RRDtool Graph for Nagios' check_disk Command
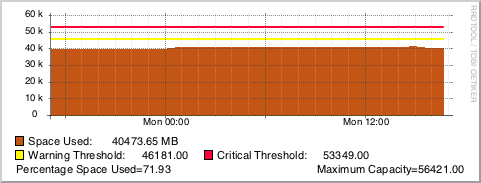
Over the past few months I’ve been working more and more with RRDtool, and since we use GroundWork at work, I thought I’d start to better the default graphs that come with GroundWork. One of the graphs I thought needed the most improvement is the graph for check_disk. See the old graph below:


Along with my other graphs, I will be using the Outlined Area Graphs colour set for my graph areas and lines.
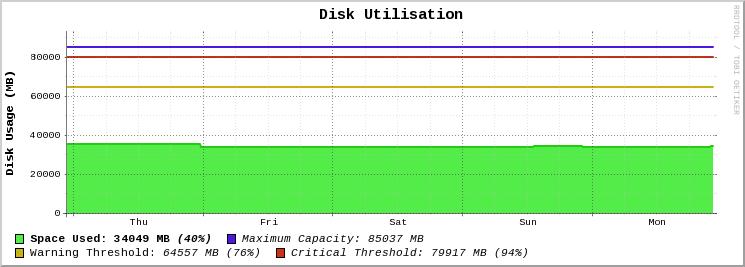
Without further ado, here is the code for the graph:
rrdtool graph - \
-E \
-P \
-h 180 \
-l 0 \
--grid-dash 1:2 \
-t "<big><b>Disk Utilisation</b></big>" \
-b 1024 \
-X 0 \
-a PNG \
-v "<b>Disk Usage (MB)</b>" \
DEF:diskCurr=rrd_source:ds_source_0:AVERAGE \
DEF:diskWarn=rrd_source:ds_source_1:AVERAGE \
DEF:diskCrit=rrd_source:ds_source_2:AVERAGE \
DEF:diskMax=rrd_source:ds_source_3:AVERAGE \
CDEF:diskPerc=diskCurr,diskMax,/,100,* \
CDEF:cdefDisk=diskCurr \
CDEF:cdefw=diskWarn \
CDEF:cdefc=diskCrit \
CDEF:cdefm=diskMax \
CDEF:warnPerc=diskWarn,diskMax,/,100,* \
CDEF:critPerc=diskCrit,diskMax,/,100,* \
AREA:diskCurr#54EC48:"<b>Space Used\:</b>\g" \
LINE2:cdefDisk#24CB14: \
GPRINT:diskCurr:LAST:" <b>%.0lf MB</b>\g" \
GPRINT:diskPerc:LAST:" <i><b>(%.0lf%%)</b></i>" \
LINE2:cdefm#4D18E4:"<i>Maximum Capacity\:</i>\g" \
GPRINT:cdefm:LAST:" <i>%.0lf MB</i>\n" \
LINE2:cdefw#C9B215:"Warning Threshold\:\g" \
GPRINT:cdefw:AVERAGE:" <i>%.0lf MB</i>\g" \
GPRINT:warnPerc:LAST:" <i>(%0.lf%%)</i>" \
LINE2:cdefc#CC3118:"<i>Critical Threshold\:</i>\g" \
GPRINT:cdefc:LAST:" <i>%.0lf MB</i>\g" \
GPRINT:critPerc:LAST:" <i>(%.0lf%%)</i>\n" \
-c BACK#FFFFFF \
-c CANVAS#FFFFFF \
-c GRID#C0C0C0 \
-c MGRID#404040 \
-c ARROW#FFFFFF \
-Y
rrdtool graph -— this will tell rrdtool that we’re making a graph, and the output will go to stdout (needed for GroundWork, otherwise you can put something like disk_usage.png).-E— aka--slope-modegives the graph a more organic and natural look.-P— uses Pango markup to render all text with HTML, so you can use tags like<b></code> or <code class="inline"><i>. There are more available, you can check out Pango Reference Manual.-h 180— this sets the height of the graph to 180 pixels.-l 0— this sets the lowest number (or limit) of the Y-axis to 0, because obviously, a storage device can’t have a negative capacity.--grid-dash 1:2— gives us nice and small dotted lines for the graph.-t "<big><b>Disk Utilisation</b></big>"— the title for the graph, with Pango-supported HTML to make the title bigger and bolder (as the tags would suggest).-b 1024— as we are dealing with storage capacity, we measure the data in base2.-X 0— disables the unit exponent scaling for this graph.-a PNG— formats the output of the graph as a PNG. Depending on what setting you have, it could impact some other settings (i.e.--no-gridfit).-v "<b>Disk Usage (MB)</b>"— this sets a vertical title on the left-side of the Y-axis.DEF:diskCurr=rrd_source:ds_source_0:AVERAGE— this defines a variable calleddiskCurrwhich is sourced from the RRD. GroundWork automatically fetches this for you. From the command line, you would manually specify both the path to the RRD, and the data source (i.e. server17.pretendco.com_ssh_disk_boot.rrd:_dev_disk0s2).DEF:diskWarn=rrd_source:ds_source_1:AVERAGE— same as above, but gets the warning level for the disk (in MB).DEF:diskCrit=rrd_source:ds_source_2:AVERAGE— same as above, but gets the critical level for the disk (in MB).DEF:diskMax=rrd_source:ds_source_3:AVERAGE— same as above, but gets the maximum size of the disk (in MB).CDEF:diskPerc=diskCurr,diskMax,/,100,*— this command (CDEF) copies the values of a variable(s), and math can be performed using rpn (Reverse Polish Notation). The standard way of writing this isdiskPerc = (diskCurr / diskMax) * 100as we are calculating the percentage used of the disk. I won’t delve into the complexities of RPN, but take a look at the Wikipedia article.CDEF:cdefDisk=diskCurr— assign another variable calledcdefDiskwhich copies thediskCurrvariable.CDEF:cdefw=diskWarn— as above, copy one variable to another.CDEF:cdefc=diskCrit— as above, copy one variable to another.CDEF:cdefm=diskMax— as above, copy one variable to another.CDEF:warnPerc=diskWarn,diskMax,/,100,*— calculate the warning level as a percentage. In standard mathematics, your equation would bewarnPerc = (diskWarn / diskMax) * 100.CDEF:critPerc=diskCrit,diskMax,/,100,*— like above, calculate the critical level as a percentage.AREA:diskCurr#54EC48:"<b>Space Used\:</b>\g"— graph the area of the variablediskCurrwith the colour #54EC48, then print Space Used: in bold, with a string modifier (\g) to strip whitespace at the end of the string.LINE2:cdefDisk#24CB14:— print a line on the graph that is 2 pixels thick, with the value ofcdefDiskand the colour #24CB14. Note the extra colon (:) at the end, this means we’re not printing any string in the legend (below the graph).GPRINT:diskCurr:LAST:" %.0lf MB\g"— print the last value ofdiskCurras an integer with MB at the end.GPRINT:diskPerc:LAST:" (%.0lf%%)"— print the percentage of the disk used. Note the double percentage, the first percentage symbol escapes the second symbol (so RRDtool doesn’t think we’re trying to print a number).LINE2:cdefm#4D18E4:"Maximum Capacity\:\g"— draw a line on the graph that represents the maximum capacity of the storage device.GPRINT:cdefm:LAST:" %.0lf MB\n"— print the maximum capacity of the storage device in megabytes (MB).LINE2:cdefw#C9B215:"Warning Threshold\:\g"— draw a line on the graph that represents the warning threshold of space used.GPRINT:cdefw:AVERAGE:" %.0lf MB\g"— print the warning threshold in MB.GPRINT:warnPerc:LAST:" (%0.lf%%)"— print the warning threshold as a percentage.LINE2:cdefc#CC3118:"Critical Threshold\:\g"— draw a line on the graph that represents the critical threshold of space used.GPRINT:cdefc:LAST:" %.0lf MB\g"— print the critical threshold in MB.GPRINT:critPerc:LAST:" (%.0lf%%)\n"— print the critical threshold has a percentage.-c BACK#FFFFFF— change the background colour of the graph to #FFFFFF (white).-c CANVAS#FFFFFF— change the canvas colour (the actual graph itself) of the graph to #FFFFFF (white).-c GRID#C0C0C0— change the grid colour to #C0C0C0 (light gray).-c MGRID#404040— change the major grid colour to #404040 (dark gray).-c ARROW#FFFFFF— change the arrow colours to #FFFFFF (white) to hide them.-Y— enables the nice dynamic Y-axis grid that gives you whole numbers and ensures you don’t have too many horizontal lines that could make the graph messy or hard to understand.
You can also take a look at the gist for the code.
Enjoy!