Folder Size Monitoring with Nagios and RRDtool
Recently at my place of employment we’ve had a few customers have their log folders explode in size and crash their servers. Since we already monitor OS X Servers using GroundWork, I decided to write my own folder size Nagios plugin checks folder sizes that alerts if they get too large, and returns performance data for use with RRDtool.
Bash Hokery
The Bash script called check_folder_size.sh (which can be obtained at the GitHub repo) should be uploaded to any folder on the OS X Server you want to monitor.
To test the script, cd into the directory where the Bash script is, then you can test it doing ./check_folder_size.sh -f /Library/Logs -w 1024 -c 2048.
Your required flags for the Bash script are:
f— the path for the folder you want to get the size for (wrap the path in " double quotes if there’s a space)w— the warning level (in MB).c— the critical level (in MB).
And the one optional flag, which shouldn’t be used for this particular Nagios plugin, is:
m— block size for the folder (e.g. k for KB, m for MB and g for GB)
For your service check command line, enter something like this: check_by_ssh_folder_size!/Library/Logs/!m!1024!2048. See below:
check_by_ssh_folder_size— this is my command in Nagios for the check.!/Library/Logs— the folder path for sizing up.!m— we want return data in MB.!1024— the warning level in MB.!2048— the critical level in MB.
RRDtool Doo-Hickey
Below is the RRDtool create command (this is used in GroundWork, but may be used for other platforms)
$RRDTOOL$ create $RRDNAME$ --step 300 --start n-1yr $LISTSTART$ DS:$LABEL#$:GAUGE:95040:U:U DS:$LABEL#$_wn:GAUGE:95040:U:U DS:$LABEL#$_cr:GAUGE:95040:U:U $LISTEND$ RRA:AVERAGE:0.5:1:8640 RRA:AVERAGE:0.5:12:9480
And below is the RRDtool update command for each check that is performed. Here we update the RRD file with the last check time, the folder size in MB, the warning level and critical level.
$RRDTOOL$ update $RRDNAME$ $LASTCHECK$:$VALUE1$:$WARN1$:$CRIT1$ 2>&1
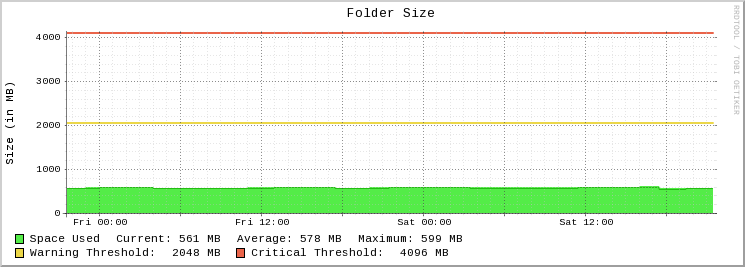
Finally, we have the RRDtool graph command that generates a nice, custom graph for visual output of performance data.
rrdtool graph - \
--slope-mode \
--height 180 \
--grid-dash 1:2 \
--title="Folder Size" \
--base 1024 \
--units-exponent 0 \
--vertical-label "Size (in MB)" \
--imgformat=PNG \
DEF:a=rrd_source:ds_source_0:AVERAGE \
DEF:w=rrd_source:ds_source_1:AVERAGE \
DEF:c=rrd_source:ds_source_2:AVERAGE \
CDEF:cdefa=a \
CDEF:cdefw=w \
CDEF:cdefc=c \
AREA:a#54EC48:"Space Used" \
LINE:cdefa#24BC14: \
GPRINT:a:LAST:"Current\: %.0lf MB" \
GPRINT:a:AVERAGE:"Average\: %.0lf MB" \
GPRINT:a:MAX:"Maximum\: %.0lf MB\n" \
LINE2:cdefw#ECD748:"Warning Threshold\:" \
GPRINT:cdefw:LAST:"%.0lf MB" \
LINE2:cdefc#EA644A:"Critical Threshold\:" \
GPRINT:cdefc:LAST:"%.0lf MB\n" \
CDEF:cdefws=a,cdefw,GT,a,0,IF \
AREA:cdefws#ECD748 \
CDEF:cdefcs=a,cdefc,GT,a,0,IF \
AREA:cdefcs#EA644A \
-c BACK#FFFFFF \
-c CANVAS#FFFFFF \
-c GRID#C0C0C0 \
-c MGRID#404040 \
-c ARROW#FFFFFF \
-Y
Explanation of the RRDtool graph
rrdtool graph -this will tell rrdtool that we’re making a graph, and the output will go to stdout (needed for GroundWork, otherwise you can put something like folder_size.png).--slope-mode- this gives the graph a nice organic look, rather than the default step-like lines.--height 180- make the graph 180 pixels in height.--grid-dash 1:2- this will make the grid lines slightly dashed (1:3 ratio will make a dotted line).--title "Folder Size"- gives the graph a nice large title.--base 1024- as we are graphing storage, we want the numbers in base 2.--units-exponent 0- this will prevent automatic y-axis scaling (it messes up my graph).--vertical-label "Size (in MB)"- puts a label on the left-hand side of the graph (text is printed vertically).--imgformat=PNG- format the output image as a PNG.DEF:a=rrd_source:ds_source_0:AVERAGE- set a variableawith the value of the folder size in MB.DEF:w=rrd_source:ds_source_1:AVERAGE- set a variablew(warning) with the warning level value.DEF:c=rrd_source:ds_source_2:AVERAGE- set a variablec(critical) with the critical level value.CDEF:cdefa/w/c=a/w/c- define more variables for later calculations.AREA:a#54EC48:"Space Used"- define an area on the graph with the variable (a), and the colour (#54EC48) (colour is made with rgb components) and a legend “Space Used”.LINE:cdefa#24BC14:- graph a line at the top of the main area.GPRINT:a:LAST:"Current\: %.0lf MB"- print the text “Current: XXX MB” to the graph (on the same line as the text “Space Used”) which has the most recent rrd entry.GPRINT:a:AVERAGE:"Average\: %.0lf MB"- print the text “Average: XXX MB” to the graph (on the same lines as the other text so far), which displays the average in MB.GPRINT:a:MAX:"Maximum\: %.0lf MB\n"- print the text “Maximum: XXX MB” to the graph, along with a newline character at the end.LINE2:cdefw#ECD748:"Warning Threshold\:"- draw a warning level line on the graph, with the rgb colour.GPRINT:cdefc:LAST:"%.0lf MB"- print the warning level in MB.LINE2:cdefc#EA644A:"Critical Threshold\:"- draw the critical level line on the graph.GPRINT:cdefc:LAST:"%.0lf MB\n"- print the critical level in MB, along with a newline character.CDEF:cdefws=a,cdefw,GT,a,0,IF- using a calculated define, we can work out if the folder size is larger than the folder size, and if it is, we’ll change the graph colour on the next line.AREA:cdefws#ECD748- using the calculation above, change the colour of the graph.CDEF:cdefcs=a,cdefc,GT,a,0,IF- like above, do another calculation to see if the folder size is larger than the critical level.AREA:cdefc#EA644A- as above, colour the graph to the appropriate colour if it reaches or goes over the critical threshold.-c BACK#FFFFFF- change the background colour of the graph to white (#FFFFFF).-c CANVAS#FFFFFF- change the colour of the graph canvas to white.-c GRID#C0C0C0- change the grid colour to a light-ish grey.-c ARROW#FFFFFF- change the colour of the graph arrows to white, to hide them all together.-Y- scale the graph to integers dynamically on the graph’s Y axis.
Once you’ve got this all set up, you should be getting wonderful graphs (like the one above), along with performance data.